Hi everyone! I hope you have had a good week so far and that Friday brings a great finish for you as well! I am going to link up with
Mrs. Laffin's Laughings for a Peek at My Week.
So my 6th grade math partners and I decided to finish up our unit on equations and inequalities before leaving for break. We scheduled the test for Thursday to give us enough time on Friday for self-assessments, test corrections, celebrations, and of course, make-up testing. We have really been into data as a school this year, which has prompted me to keep track of student data outside of just keeping a grade book. I have found that I collect and analyze as many non-graded pieces of work during the week as I do graded pieces. Here is how the week shaped up:
Monday - We finished discussing the last piece of new material (substituting into inequalities to find solutions) and assigned a short 6 question homework assignment.
Tuesday - We reviewed homework, completed a graphic organizer (made with a cute chevron pattern-maybe it will one day be in my TpT store), and did a ticket out the door. Here is the best part: The ticket out the door had 6 questions, one of each skill that the test was going to assess. I let the students use their graphic organizer for one very important reason. If they could be successful on the ticket out the door with their graphic organizer, but didn't do well on the test, I knew that they really just didn't study the material well enough to know what to do when. If they couldn't get the questions correct even with the graphic organizer, I knew I would need to do more work with them on Wednesday.
Here is how I analyze data that is not in my actual grade book. I have one master excel file that includes all 5 of my classes. I have each student, any special information such as testing accommodations, and column after column of formative assessment data. Once you get the excel file set up, it is just as easy to add information here as it is to a grade book. I let excel do all of the calculations for me. I have highlighted below how to let excel calculate the percent proficient for each particular assignment (I set it at 70).
The formula is (COUNTIF(P5:P25,">=70")/COUNT(P5:P25))*100
Wednesday - I arranged groups based on my ticket out the door data. I do NOT record ticket out the door data into the grade book. The average column is really for me to see more class information. Also, in fairness to the students, a score of 4 out of 6 would cause the student to show up as not proficient. This gives me good data to base instruction, but does not represent a fair grade in the grade book (in my opinion). I retaught word problems with equations to the whole class (based on the data) and then made different activities for other areas of weakness. I was able to pull 5-6 students to the back table to work with me, while other students worked on technology or practiced other self-correcting work independently.
Thursday - TEST Day! After grading tests today, I am extremely pleased with the results! It is so rewarding to see students who received not proficient scores earlier in the week make HUGE strides. Sharing the data with the students can be a huge motivating factor if done correctly. These types of formative assessments give students a way to get help in the area(s) they need it most.
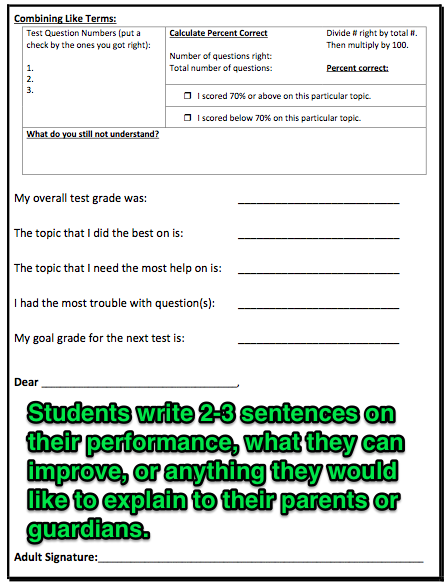
Friday - Tomorrow we will complete a self-assessment form (another potential TpT product that I have created) that will allow students to calculate their percent proficient in each sub-section of the test. We will then work on test corrections. As a reward, students that have made a proficient score will celebrate by bringing in a snack during class!
This is the first year that I have ever kept numerical data on students outside of the normal grade book. So far, it is providing extremely valuable information to help me meet students where they are.
Happy calculating,
Kim


.png)
.png)
.png)
.png)


